Instructions for Koalatative test planning + test analysis templates

This article will give you a complete overview of how to get the most value out of the Koalatative test planning + test analysis templates.
The purpose for creating these templates was a deep-rooted frustration and an inherent need as it is for most good “products” out there. When you’ve been working with AB tests for a long time you get to know most of the tools on the market together with their strengths and limitations. There are of course free calculators out there that you can use, but those come with a set of limitations as well. Free calculators only let you do one calculation at a time, and then if you want to save the results you still need to copy and paste them somewhere else. With our templates, you only need to enter the data once (which can easily be automated), and then all the calculations happen automatically in the same sheet.
The other issue is that every online test calculator and experimentation tool has a different set of assumptions and decisions that are made for you behind the scenes. Some testing tools even use data from other people's experiments to tell you whether your test is significant.
We’ve developed two templates, one for pre-test planning and another for post-test analysis.
The pre-test planning template will:
give you a quick reference to see how many weeks you need to run an experiment on any particular page or content group.
balance false positive rate, false negative rate, and test duration, to find the best tradeoff for your business context.
quickly show you where you should focus your efforts and where it's not worth it before you invest time and resources into mocking up test ideas.
The post-test analysis template will:
Keep your data in one place. Once your test has ended, just enter the data once and it will be safe and sound in a Google Sheet where it's easy to share as is or integrate into a nicer report.
Use transparent statistics. Instead of relying on a black box proprietary stats engine, you can use industry-standard statistics and have control over all the parameters.
Calculate everything automatically. Once you enter your test data, all of the stats are calculated for you immediately so you can see the conversion rates, observed effects, and p-values of each segment and metric.
What follows is a detailed set of instructions that you can always refer back to while using these templates and/or working on your own experimentation program.
General Information
Legend
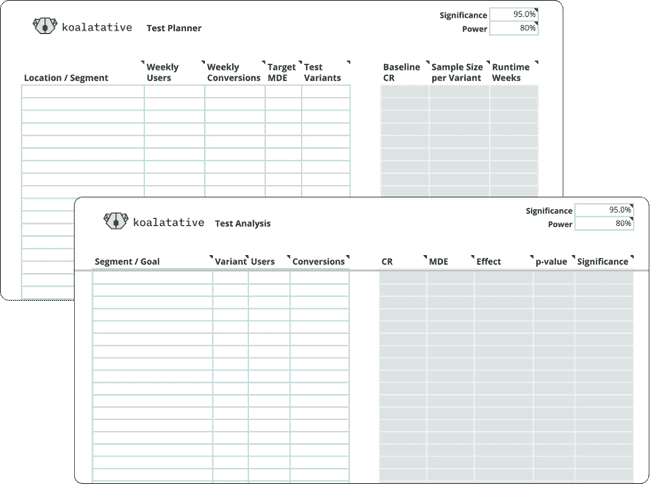
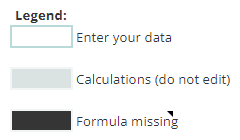
There are a few different types of cells in these templates. Other than the labels, whitespace, and our lovely Koalatative logo, there are cells for user input, and cells where the calculations happen. Each template has a legend off to the right side like this:
The cells with the formulas are protected, so if you try to edit one you’ll get a warning that looks like this:
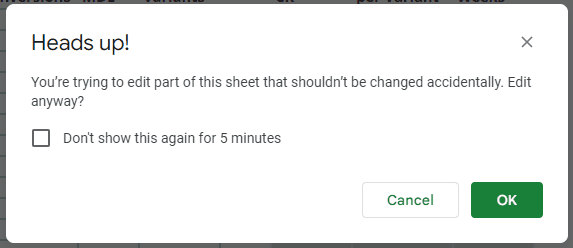
If you want to dig in and tweak the formulas then go right ahead and click past the warning, as long as you know what you’re doing. If you happen to accidentally delete a formula, there’s an extra layer of protection where that cell will turn black to make it obvious that it needs attention.
All of the formulas in these protected cell ranges are portable within the same column, which means that you can copy and paste the formula from anywhere in the same column and it will adapt itself to the new location. If you’ve somehow deleted all the formulas in the column, then you’ll have to grab a fresh copy of the template and fetch the formula from there.
It’s also worth noting that the formulas have some built-in input and error checks, so they won’t display anything until you have entered the data they need in the relevant cells. And if there’s a problem with the data, they’ll stay blank, so if you think you’ve entered all the data and the calculated result still isn’t showing up, make sure that your inputs are in the right format - if you enter text when it’s expecting numbers, it can’t do the calculation!
Assumptions and Limitations
These templates, like any statistical calculator, rely on certain assumptions. We’ve tried to align these as closely as possible with typical website AB testing scenarios, but there’s not always a single right answer for these things, so we have to make some judgment calls.
We’ll list some of the basic assumptions and limitations here:
These templates are for frequentist test planning and analysis (rather than Bayesian).
It’s assumed that your null hypothesis is that the variant is the same as or worse than control, and the alternative hypothesis is that the variant is better than control. What this translates to in plain English is that you want to prove that the treatment performs better than the baseline in order to implement it permanently on the site, otherwise, you’ll keep the baseline experience.
Related to point 2, these templates use a one-sided test (also known as one-tailed) instead of two-sided / two-tailed. There’s a lot of debate about this topic in the CRO community, and typically it boils down to the proponents of two-tailed tests wanting more precision, which is not quite the correct use of a two-tailed test, and you can accomplish the same thing by adjusting your desired significance level and using a one-tailed test.
The test planner assumes that you want to run your experiment for a number of weeks, and this will be rounded up. So if the calculation specifies that you need 3.4 weeks to hit your needed sample size, it will output a runtime of 4 weeks. It’s better to run the test a bit too long than too short.
Both templates assume that you are measuring your results using a binary metric like transactions. You can use whatever metric you want as your conversion of course, but it’s best to get as close to the money as you can. So if it’s e-commerce then in most cases you should use purchases, but you may want to go with something else if you don’t have enough volume for that, or if your test is intended to influence something more specific like say cart ads. If it’s lead gen then a conversion would be form submissions, booked calls, etc. Working with a metric that doesn’t just give a yes or no answer for each user can be a pretty good approach. Examples of this would be revenue per user, average order value, or engagement metrics like session duration, pageviews, etc. But it’s a lot more complex to run the stats on continuous metrics, and there are very few calculators that can do it. They all rely on uploading more raw data or a variance estimate in order to do those calculations, so the Koalatative templates are focused on the more simple use case of binary metrics.
There is no adjustment for multiple metrics / segments / variants. If you want to make the statistics purist PHDs happy, then you would need to account for the fact that looking at more than one metric, drilling into segments, and testing more than one variant against the control, will all inflate your false positive rate, and compensate for this. I would argue that this depends on the question you want the statistics to answer: do you want to know how likely it is that variant 2 is better than control, or do you want to know how likely it is that at least one variant is better than control? It’s pretty easy to get into the weeds on these issues, but the general philosophy that is built into the templates is to keep things as intuitive and simple as possible while keeping the error rates transparent. So it’s possible that, depending on the question you are asking, you’ll have a higher false positive rate than what your chosen significance level would suggest.
Ok with the boring details out of the way, let’s jump into how to actually put these to use.
Test Planner
Step 1: Enter the traffic and conversion data
What data we’re looking for
In order to do our test planning calculations, we need to know the traffic and conversion volume for the page / screen where the test will be run. In most cases, this would be the number of users who visited the page per week, and the number of those users who converted. In some cases, you may want to use sessions instead of users, but usually, this is a bad idea (one reason is that since the same user can have multiple sessions, it violates the independent observations assumption of statistical tests).
Where and how to get the data
In most cases, you’ll be fetching the data directly from your analytics system, whether that’s GA4, or something else entirely. There aren’t any default reports that will get you what you need unfortunately, so you’ll have to put together a custom report, use queries with an API or connector of some sort, or the method I use most often, use the segment builder.
Note: we don’t have to actually create a segment to get the numbers we need, we’re just using the builder tool to get the number of users who meet certain criteria, and we can grab the numbers from the preview.
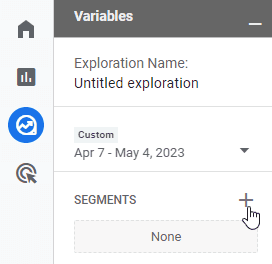
To find this in GA4, go to Explore, and click into any existing Exploration or create a new blank one:

At this point, you’ll need to set the date range. This should be some number of weeks. The number to go with depends mostly on how volatile your traffic is. We’re going to be working with weekly data anyway, so it depends on how far back you want to average out your traffic. If you’re doing this a couple of weeks after BFCM, then you might want to go with a shorter range to exclude the non-typical volume, but I normally use 4, 8, or 12 weeks. In our example, we’ll go with 4 weeks.
Once you’ve selected the right date range, click the + to open the segment builder:
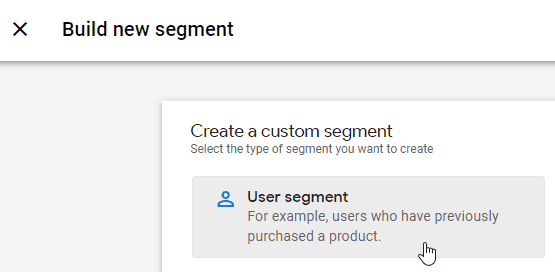
Since we’re interested in users, we’ll choose “User segment”:
Now we’ll add the conditions to get what we want. For our example, let’s say we want to run an experiment on the product page template for a Shopify site, so we’ll be targeting all product pages at once. You’ll repeat the next two steps for each testing location you want to add to the planning sheet.
Weekly users
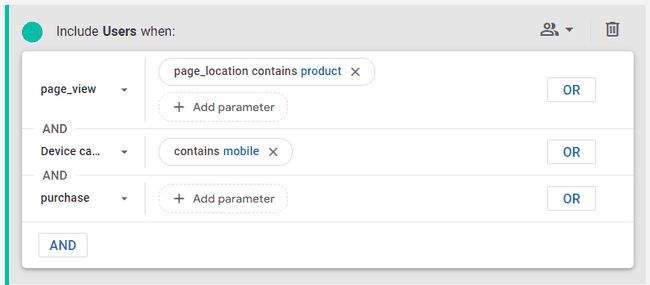
The first step is to get the number of users who visited any product page and therefore could be influenced by an experiment there:
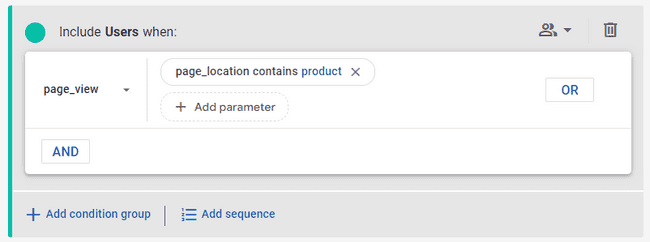
The Summary section to the right will show us how many users had a page_view event where the page_location contained “product”:
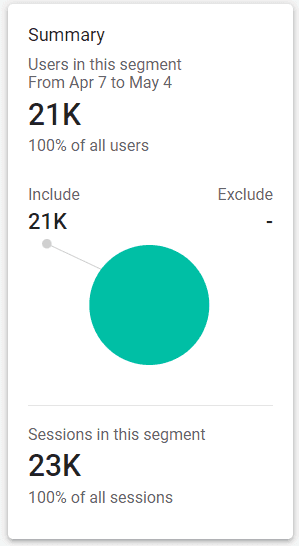
That’s it! You can divide that by 4 to get the weekly average, and pop that number into the Weekly Users column in the Test Planner, next to “Product pages” as the Location / Segment.
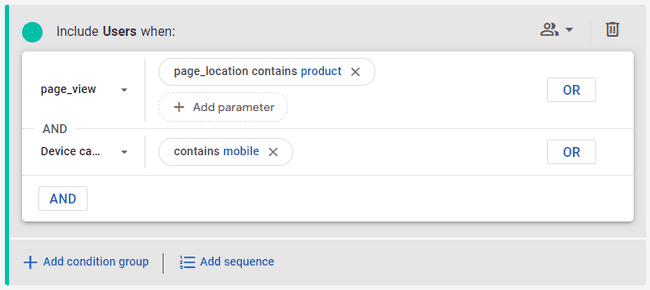
Tip: most of the time you should run tests separately for desktop and mobile, so it’s a good idea to pull the numbers separately as well. In that case, your Location / Segment entries would be “Product pages / Desktop” and “Product pages / Mobile”, and you’d add another condition to the segment builder like this:
At this point, the most efficient way is to pull the weekly users for all of the testing locations you’re interested in, before moving on to conversions. On a typical e-com site, the main testing locations would be:
Sitewide
Homepage
All category pages / PLPs
All product pages / PDPs
Single PLP
Single PDP
Cart
Checkout Step 1
Checkout Step 2
Any other page or groups of pages where you might want to run experiments
Weekly conversions
What we’re looking for here is the number of users who visited each testing location and then converted. This tells us the number of conversions that flow through the page(s) where you want to run the test. To get this, we just need to add another condition to the segment builder for the “purchase” event:
Once you’ve applied the new condition, go ahead and grab the user count from the Summary on the right, divide it by the number of weeks in the time range you chose (in our case 4 weeks), and put it in the Weekly Conversions column.
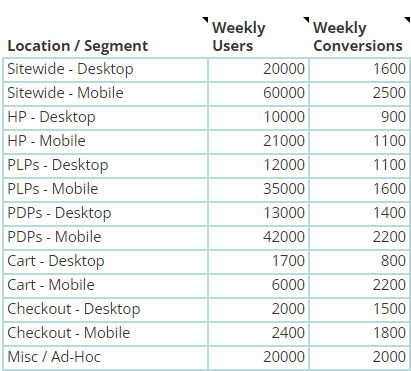
Now change the page_location parameter to the next testing location, and repeat the process until you’ve filled in the Weekly Users and Weekly Conversions for all the testing locations you’re interested in. If you’re doing mobile and desktop separately, switch the Device category parameter and pull those numbers too. Once you’re done you should have something like this:
That’s it! You’re ready to choose your test parameters and see the results.
Bonus: Ways to automate this
As you can see, this part of the process is a bit tedious and time-consuming. At least if you’re using this template you can batch this process and have the numbers handy when you need them, rather than doing it one row at a time with an online calculator every time you want to plan a test. Normally I would refresh the numbers once a month or once per quarter to have the best chance of the traffic in the experiment being as close as possible to what’s in the planner.
But you know what would be ever better than that? Setting this up once, and having the data refreshed automatically every day or every week. This is beyond the scope of this document, but there are ways to do it. We’ve done this with the Google Analytics Sheets Add-on, and it works quite well. You can either set up segments in GA in advance, and use those in the add-on, or define dynamic segments in your Google Sheet.
The problem is that this add-on doesn’t yet support GA4 (if it ever will). So for the time being, you’ll need to find another option. My solution of choice is to connect GA4 to BigQuery, and use the OWOX BI BigQuery Reports app. It’s a bit more technical since you’ll need to write SQL queries to get the data that you want, but there are some good resources out there like GA4BigQuery to help you with this. Or you could use a paid tool like Analytics Canvas. If this is all too complex, reach out to mgmt@koalatative.com and we can explore having us set it up for you.
Step 2: Choose your test parameters
Now that you have your traffic and conversion data in the template, it’s time to get into the statistics.
Target MDE
MDE means “minimal detectable effect”. At the planning stage, this is also called “minimal effect of interest”. This is the smallest relative effect you want to be able to reliably detect. For example, if you choose 5% as your Target MDE, and the power level is the default of 80%, it means that if the conversion rate of the variant is actually 5% better than control, you’ll have an 80% chance of getting a statistically significant result in the test.
This relates to the false negative rate. Ideally we would want to be able to detect any real effect, but there’s a tradeoff between your target MDE and the sample size / runtime of the test. You can play around with different numbers here, and you’ll see that as you decrease the MDE, the runtime goes up quite a bit. So although you may want to enter 1% here, if it means you need to run the test for half a year, it’s just not feasible. So the general approach is to increase it by 1-2% at a time until you get a runtime that you can live with (usually 8 weeks or less).
If your Target MDE is over 10%, and the runtime is still too long, then you have a couple options:
Reduce your Significance level,
Reduce the number of variants you are testing at a time (see below), or
Abandon the idea of running tests in this particular location, at least with these parameters.
This is often the point where an optimizer is confronted with the statistical reality of their situation. There may be some ways around this though:
If you were planning a test for a single page, and the MDE is too high or the runtime is too long, maybe you can adapt the test to run on a template or group of pages. For example, instead of running on a single product page, test a change to all product pages at once.
If you’ve separated desktop and mobile to test on them separately, if your test hypothesis applies to both devices, you can run the same test on mobile and desktop together.
AB testing on lower traffic sites can be challenging, but it’s better to understand the situation in advance instead of putting effort into a test that’s just going to be inconclusive even if you run it for months. This process can help you prioritize where to test. If testing lower traffic pages is a no go, then for now you might need to stick to sitewide tests or higher traffic pages, until your traffic increases.
Test Variants
This is where you choose the number of variants you are going to test, including the control. On a lower traffic site this should be limited to 2, but if you have the volume for it, you can test several different treatments against control in the same test. Try out different numbers here to see the effect on sample size and runtime.
Significance
The default, and widely accepted standard in AB testing, is 95%. This means that you want the p-value to be 5% or less. This is related to the false positive rate. A p-value of 0.05 would mean that if there was actually no difference between A and B, you would see the observed effect 5% of the time.
In most cases you should leave the significance at 95%, but on a higher traffic site you might increase this to 97.5% or even 99%. On a lower traffic site you might lower this to 90%. You probably shouldn’t go much lower than that, but it depends on how much tolerance you have for false positives. If you’re not sure about this, feel free to reach out and we can help you make a decision that fits your situation.
Power
Statistical power is related to false negative risk. If the power is 80%, it means you have an 80% chance of detecting a true effect, if it exists. So the converse of this is that there could be a 20% chance of having an inconclusive test even though the variant is really a winner.
In most cases you should go with 80% power as it’s the generally accepted default for AB testing. If you have the traffic for it, and you want to reduce your false negative rate even more, you can increase the power.
Step 3: Read the results
Baseline CR
This is simply the conversion rate of the testing location based on the data you entered. It’s just the weekly conversions divided by the weekly users. Pretty straightforward, right?
Sample Size per Variant
This is the number of users you would need for each variant in the experiment to achieve your Target MDE at the Significance and Power levels you specified.
Runtime Weeks
This is the number of weeks you would need to run the experiment to meet your needed sample size per variant, based on the weekly number of users who visit the testing location. It’s rounded up to the nearest whole number of weeks, so if it calculates that you need 3.4 weeks to hit your needed sample size, it will output a runtime of 4 weeks.
Once you start your experiment, you should run it for the number of weeks specified, unless the traffic in the test is much higher or lower than the weekly users you entered in the planner. Traffic isn’t always consistent or predictable, so you might hit your sample size sooner or later than expected. So it’s a good idea to check that you’ve reached the needed sample size per variant before stopping the test.
Test Analysis
Step 1: Enter the test data
What data we’re looking for
For test post-analysis, we’ll need the data of the completed experiment. If you planned your test properly, you should have run the test for the number of weeks determined by the Test Planner template, and ensured that you reached the needed sample size (in case the traffic during the test was different from what you planned for).
What we’ll need now is the number of users and conversions for each combination of segment and metric that you are interested in. The main one will be the high-level results for the main metric, for example “All Users / Transactions”, but it’s up to you which segments you want to drill into. This could be browser type, traffic source, new vs returning users, or (if you didn’t run mobile and desktop tests separately) mobile vs desktop. Keep in mind that there isn’t much you can learn from tiny segments, so this is dependent on your traffic. As a rough rule of thumb, stick to segments that have at least 1 / 5 the traffic of the overall test, or at least 100 conversions per variant as a bare minimum.
If you tracked additional metrics, you can enter those as separate lines in the template, for example “All Users / Cart Adds”.
Where and how to get the data
Depending on your testing tool setup, the tool itself is probably the easiest place to grab your test data from. We prefer a tool-agnostic approach, so we make sure the testing tool is pushing experiment and variant IDs to analytics, and then use analytics data for analysis. This allows you to look at any metric that is available in analytics instead of being limited to the ones that are tracked in the testing tool itself.
Note: if you are using GA4, there is a limitation where you can’t get true user counts in the interface or via the API as the user counts are estimated using an algorithm called HyperLogLog++. This means that you could actually make the wrong call on tests 30% of the time. See this Analytics Toolkit article for more information. There may also be issues with sampling and thresholding in GA4, so at the moment the only solution is to push your data to BigQuery and pull the numbers from there.
Entering the variant number
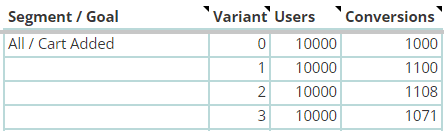
Each variant, including control, needs a number assigned to it in the analysis template. This tells the formulas which row to compare the data to for the calculations. Each variant will be compared only to the control, and not to any other variant, so control should have variant #0, variant 1 should be #1, and so on.
This is what it should look like in the template:
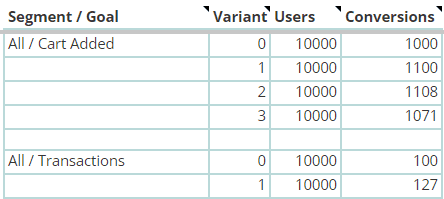
Once you’ve entered the control and variant numbers for one segment / goal, you can optionally add a blank row to make things more readable, and then start the variant numbering over again for the next segment / goal:
That’s it! Once you enter some data, the formulas will spring to life and show you what you need to know.
Step 2: Choose your test parameters
For test analysis, there aren’t as many parameters to set as there was for test planning. Both of them are set for the whole sheet rather than each row, and they are located at the top right:

Significance
This should be the same significance level that you chose during test planning. In most cases this should be 95%. For an explanation of significance, refer back to the Test Planner section, or hover over the field to see the note.
Power
This should also be the same power level that you chose during test planning. In most cases this should be 80%. For an explanation of statistical power, refer back to the Test Planner section, or hover over the field to see the note.
Step 3: Read the results
Conversion rate
This is the conversion rate for the particular variant in the same row. It’s calculated simply as the conversions divided by the users.
MDE
This is the minimal detectable effect of the variant in the same row, compared to the control. This is here primarily so that you can compare it to the MDE that you targeted during test planning. If the MDE for the primary segment and metric is higher than expected, then it likely means that you didn’t reach the sample size you had planned for, and the test should probably be run a bit longer. If it’s lower than expected, then you had more traffic in the test than needed, which isn’t a problem.
For the smaller segments, the MDE gives you an idea of what effect size would be needed for that segment to be adequately powered.
Effect
This is the relative % difference between the CR of the variant in the same row and the CR of the control.
p-value
This is the actual p-value of the variant in the same row compared to the control. It’s defined as the probability of seeing an effect at least as large, assuming there’s actually no difference between the variant and the control. In plain language, if the p-value is 0.05, and the effect size is 10%, it means that the normal variability of the conversion rate would produce an effect of 10% or larger, 5% of the time.
Significance
This is simply the inverse of the p-value. It’s also commonly called confidence level. If the p-value is 0.05, then the significance level is .95, or 95%. There isn’t a precise definition for significance but you can think of it as the probability that the result is NOT a false positive.
This is compared to your desired significance level at the top right, and there is conditional formatting so that the significance of the variant will turn green if it meets the desired significance level so that you can quickly see which variant/segment/goal combinations have reached significance.
Conclusion
If you’ve followed along, you should have a good idea of how to use these templates to properly plan your tests and then do some quick post-analysis. From there you can push interesting results to a reporting tool like Looker Studio, or just copy and paste from the analysis sheet to wherever you are reporting test results.
If you have any questions or feedback please reach out to us at mgmt@koalatative.com.
Want to know what we're up to?
We'll send you an email when we publish new content